Macro & sector charts Explore regional and sector indicators with their published source dates.
Price per unit comparables Compare recorded pricing on matching units and stated bases.
Recorded yields over time View reported and calculated yields, with their different bases kept visible.
Find assets Explore recorded transaction history, last known owners and reported sale campaigns.
Macro charts are open to everyone. Sign in with a free account for PPU, yields and Find assets. Coverage and available observations vary by market and sector.
Worked example: how does 100 Market Street, Sydney compare?
Check the acquired interest and area basis, compare completed transactions, then follow the source evidence. These are unadjusted reference points, not a valuation.
Salesforce Tower, 19.9% interestProperty value · office/retail
2026-03-16
Circular Quay, Sydney CBD
AUD 357.2m19.9% interest
AUD 28,991 / sq m NLA19.9% property value; includes retail
Notes
Subject review: Completed 2026-09-30
The base consideration benchmarks the acquired leasehold office stratum; nominal trustee shares and closing adjustments are separate. These completed Sydney CBD references differ in property mix, grade, tenure and tenancy.
100 Market Street, 50% interest
Date: Exact issuer-confirmed completion. Completed before review date; current-context benchmark
Area / units: 28,339 sqm NLA (whole property). 225.875m /50% / approximately 28,339 sqm office-stratum NLA, as described by Link Calculation: consideration ÷ 0.5 scope divisor ÷ aligned units.
Long leasehold office stratum with nominal freehold interests. The price is the 50% base property-interest benchmark, subject to closing adjustments; A$50.50 trustee shares are separate.
Two office buildings with combined NLA; no individual asset allocation. Forecast occupancy and WALE include heads of agreement and a vacancy rental guarantee. The fund distribution rate is not a property NOI yield.
Date: Exact issuer-confirmed completion. Completed before subject
Price: Agreed 19.9% property price, not 195.5 m company equity consideration · 19.9% interest.
Area / units: 61,914 sqm NLA (whole property). 357.2 m /19.9% /61,914 sqm whole property, including 1,937 sqm retail Calculation: consideration ÷ 0.199 scope divisor ÷ aligned units.
Freehold premium-grade tower; 61,914 sqm whole-property NLA includes 1,937 sqm retail. A$357.2m is the agreed value of the acquired 19.9% property interest, not the A$195.5m equity consideration. No annual actual-NOI yield is asserted.
These references are not a valuation. Prices, areas, transferred interests, lease terms and property mix differ. A later transaction was unavailable at the subject deal date. No unsupported yield is implied.
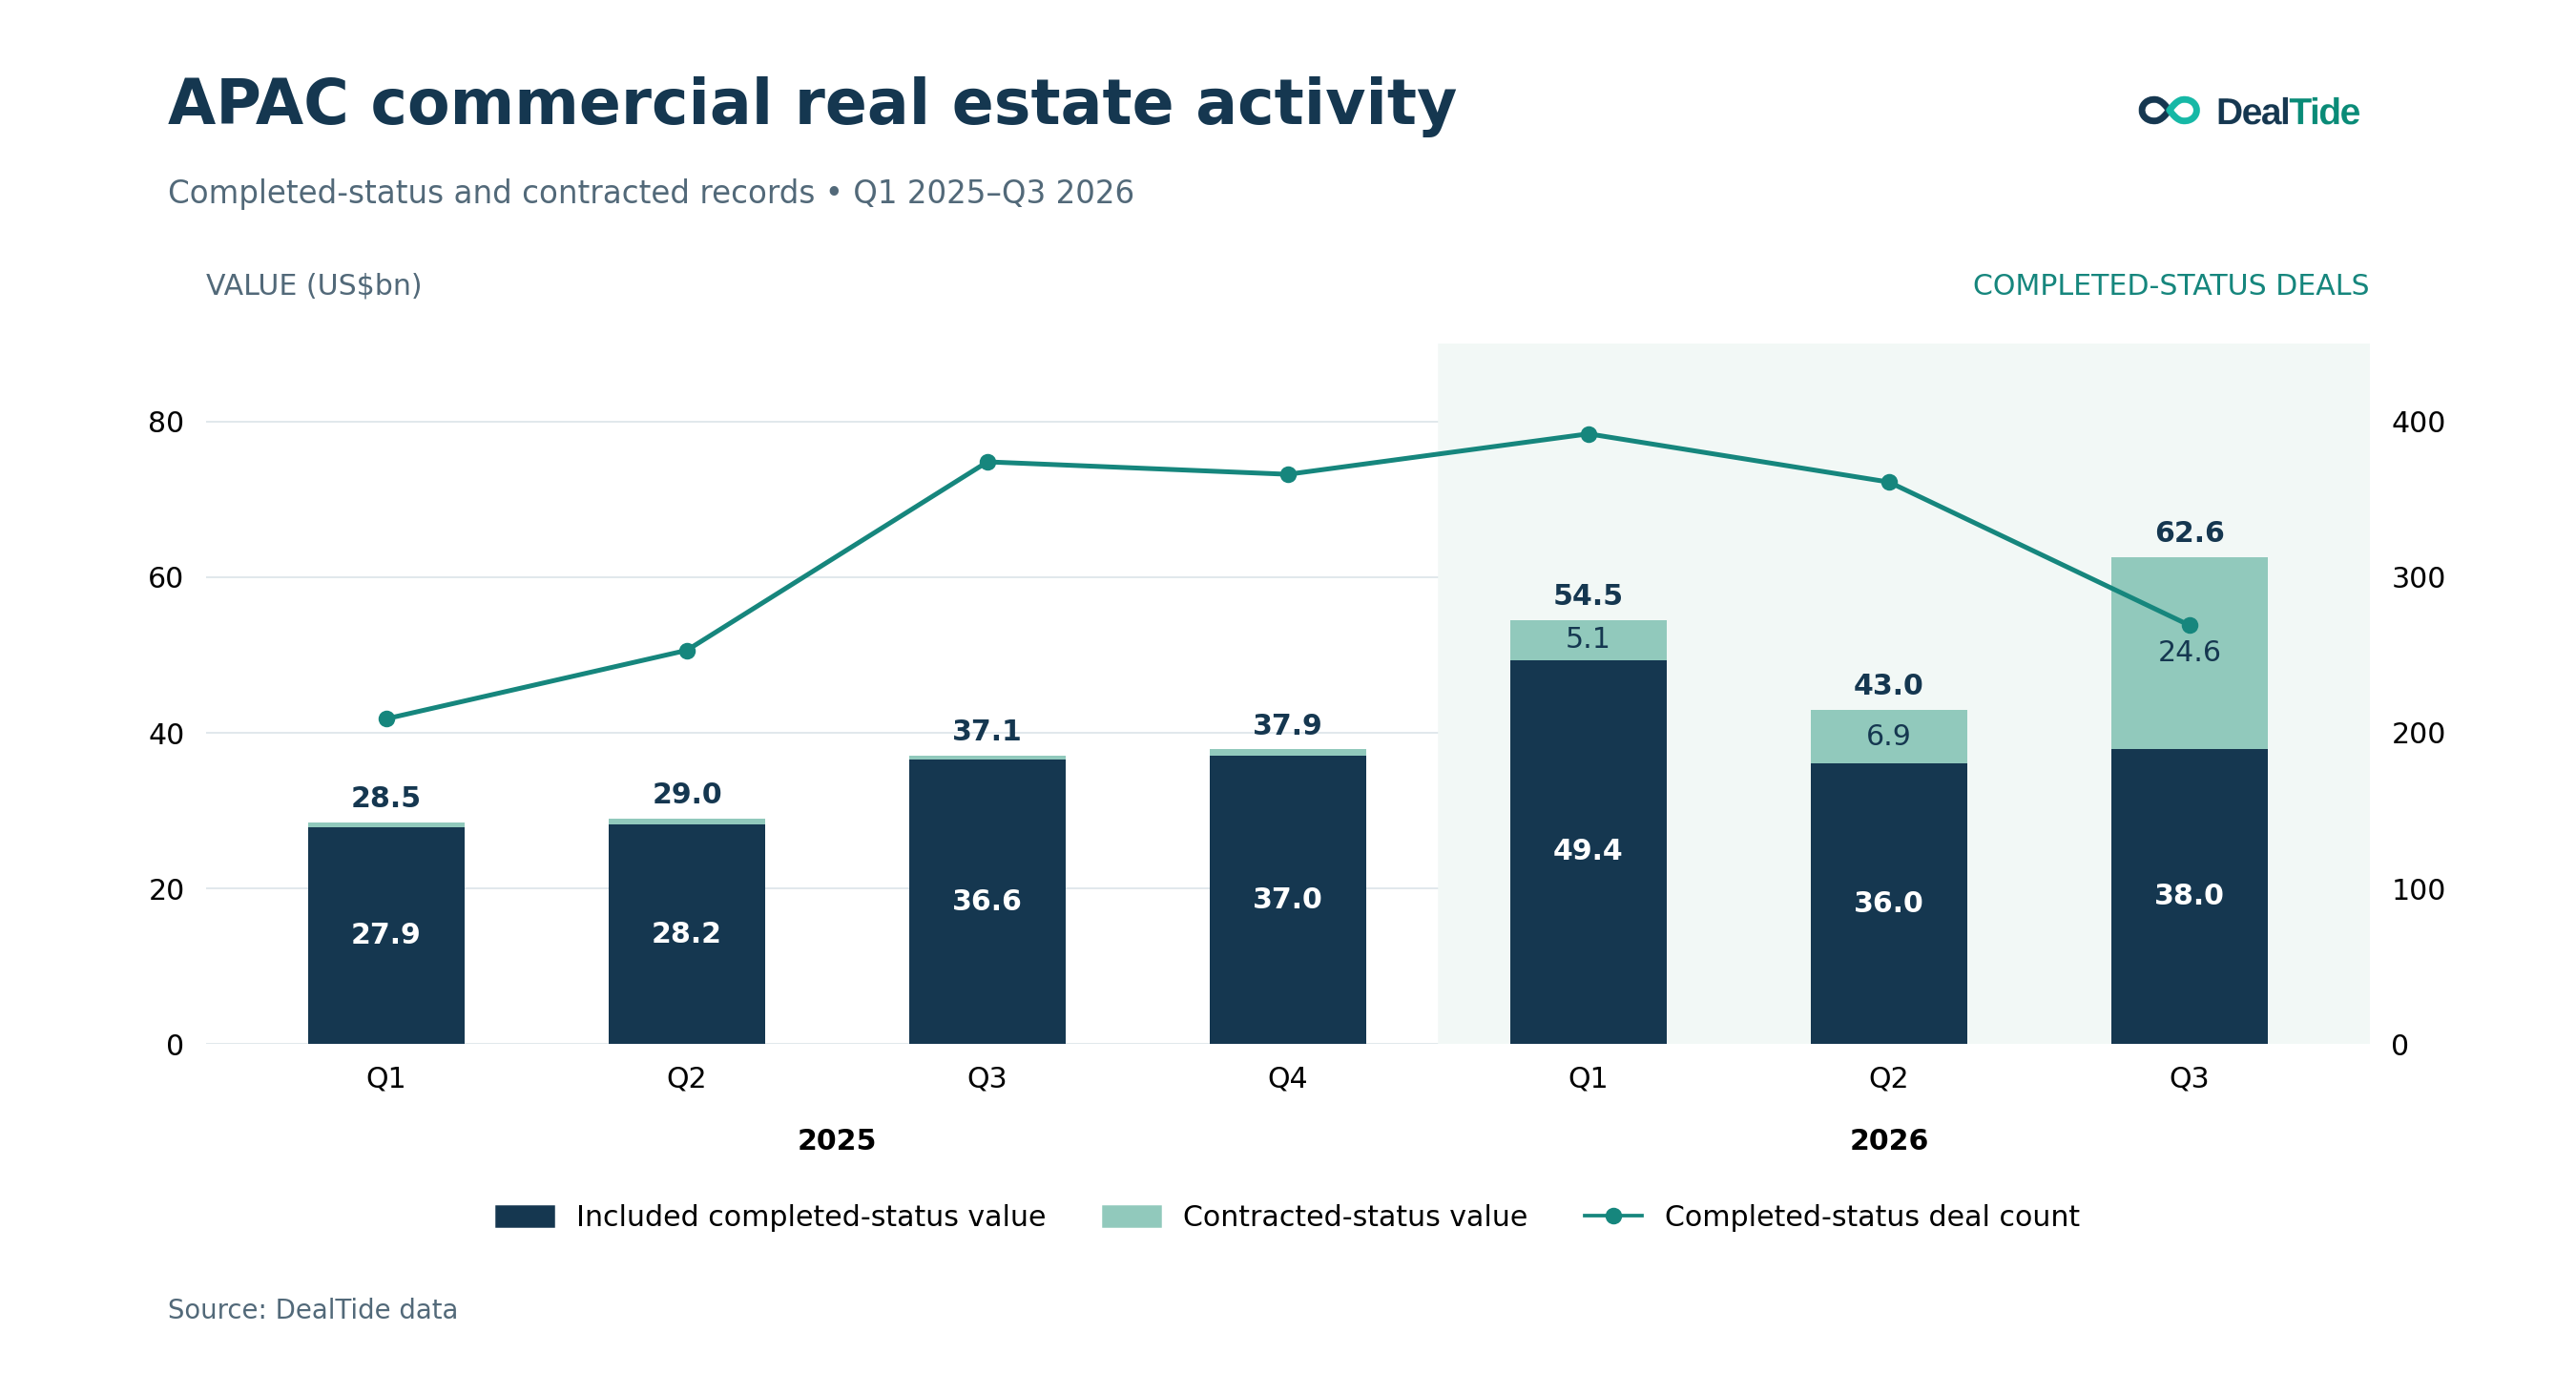
APAC data centre deal value rose to US$12.2 billion in the first nine months of 2026, from US$3.2 billion a year earlier. Without the STT GDC and WinTriX China sales, completed deal value fell 3% to US$3.1 billion, and direct asset purchases were flat at US$2.06 billion.
From NEX and One Raffles Place to IOI’s office portfolio, a growing pipeline of major properties is testing the depth of investor demand. But how many of these deals will cross the line?
Overseas institutions, REITs and developers are behind most of this year’s deals. DealTide looks at who bought, the yields they accepted, and the deals that could push the total past S$50bn.
A hotel REIT sells at a 1.5% yield on historical income and buys at a 3.4% forecast yield. International funds hand assets to new owners. Japan’s latest deals reveal how much investors will pay for the next stage of growth.
Deals are back, and DealTide’s figures show more transactions at a smaller average size. The recovery in rents and financing is less even: buyers are finding different reasons to act.
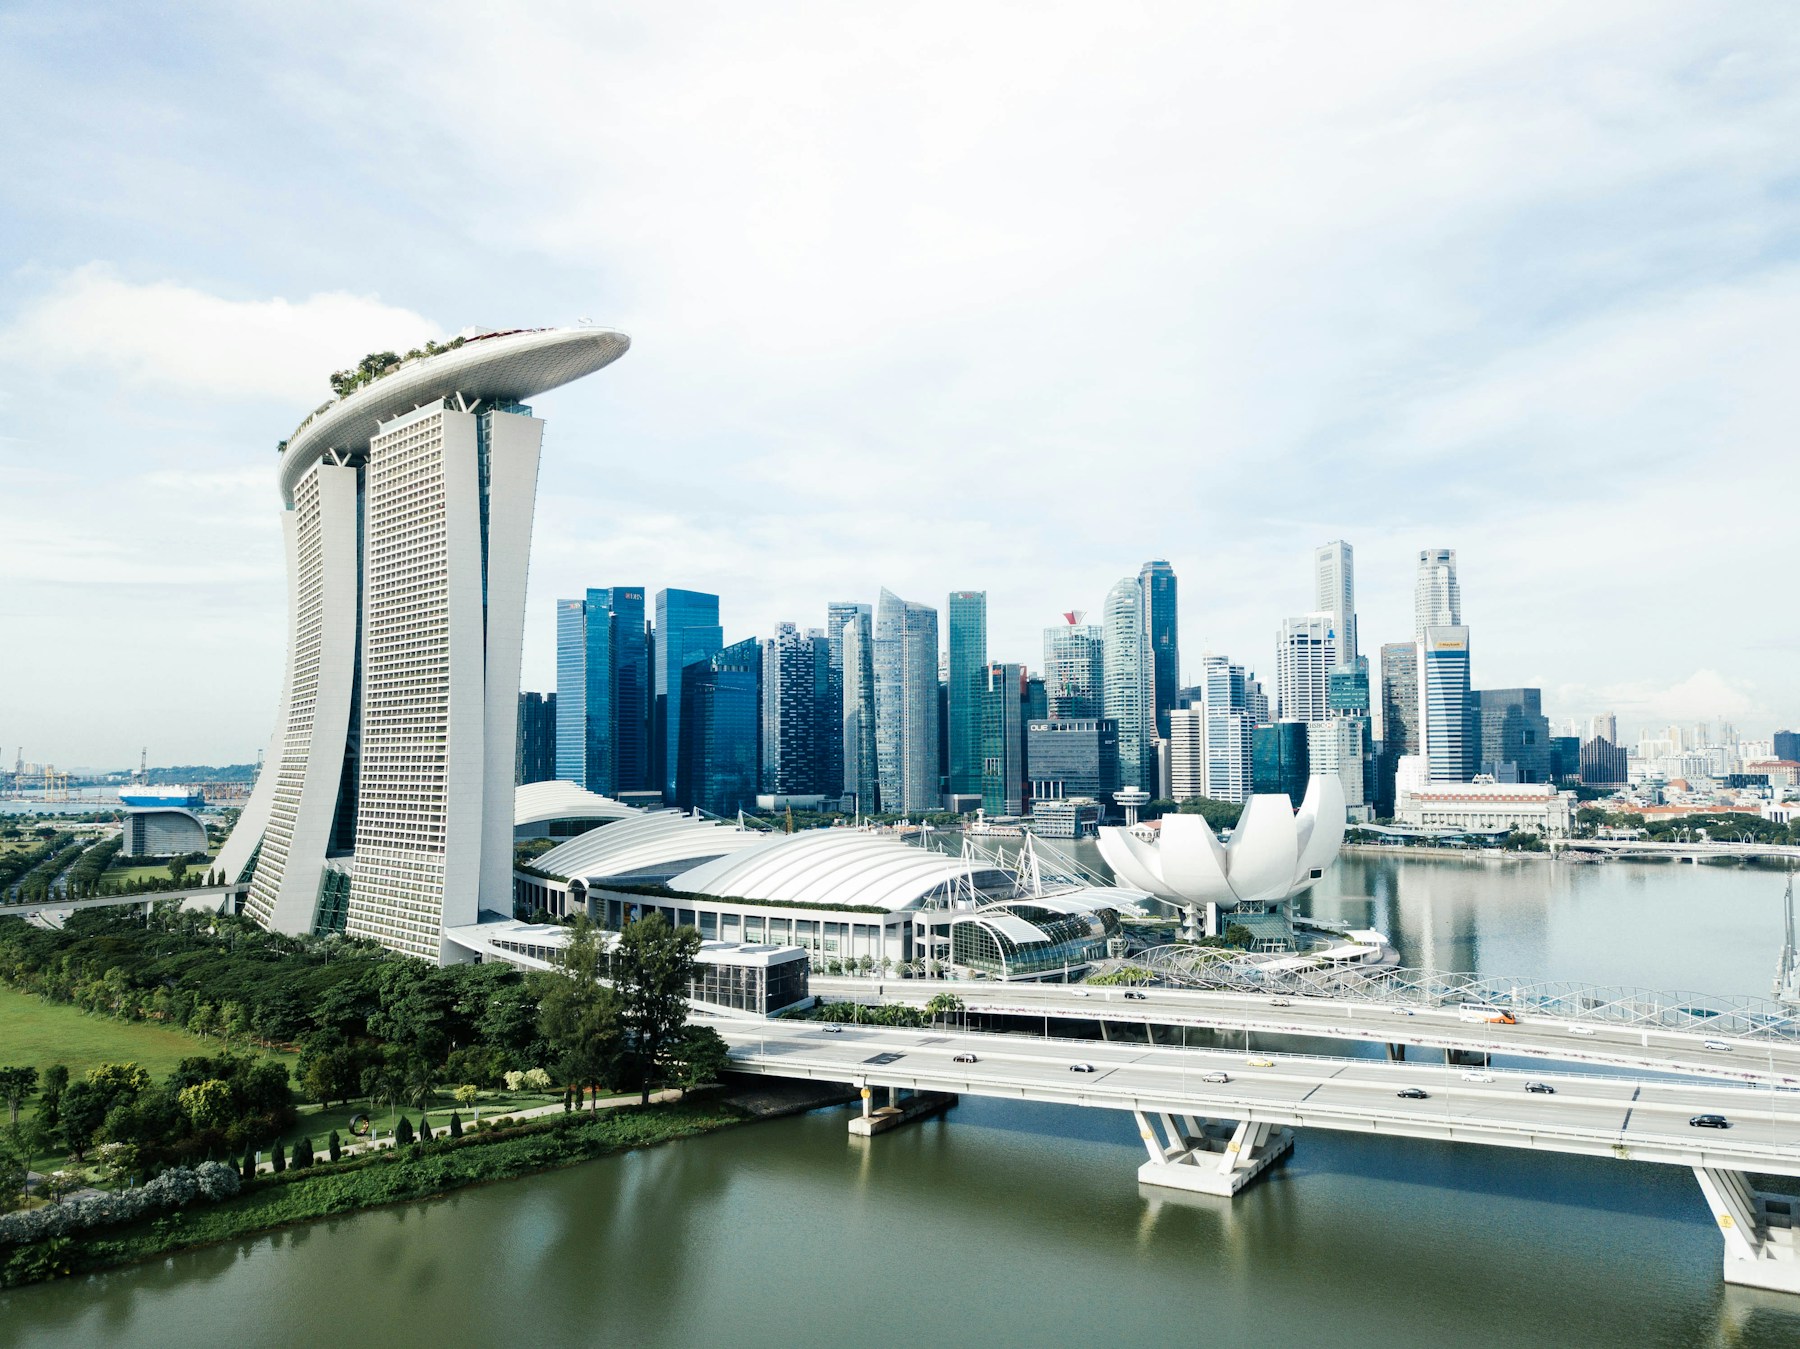
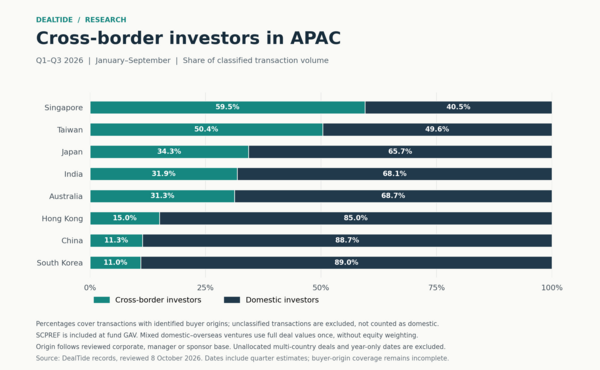
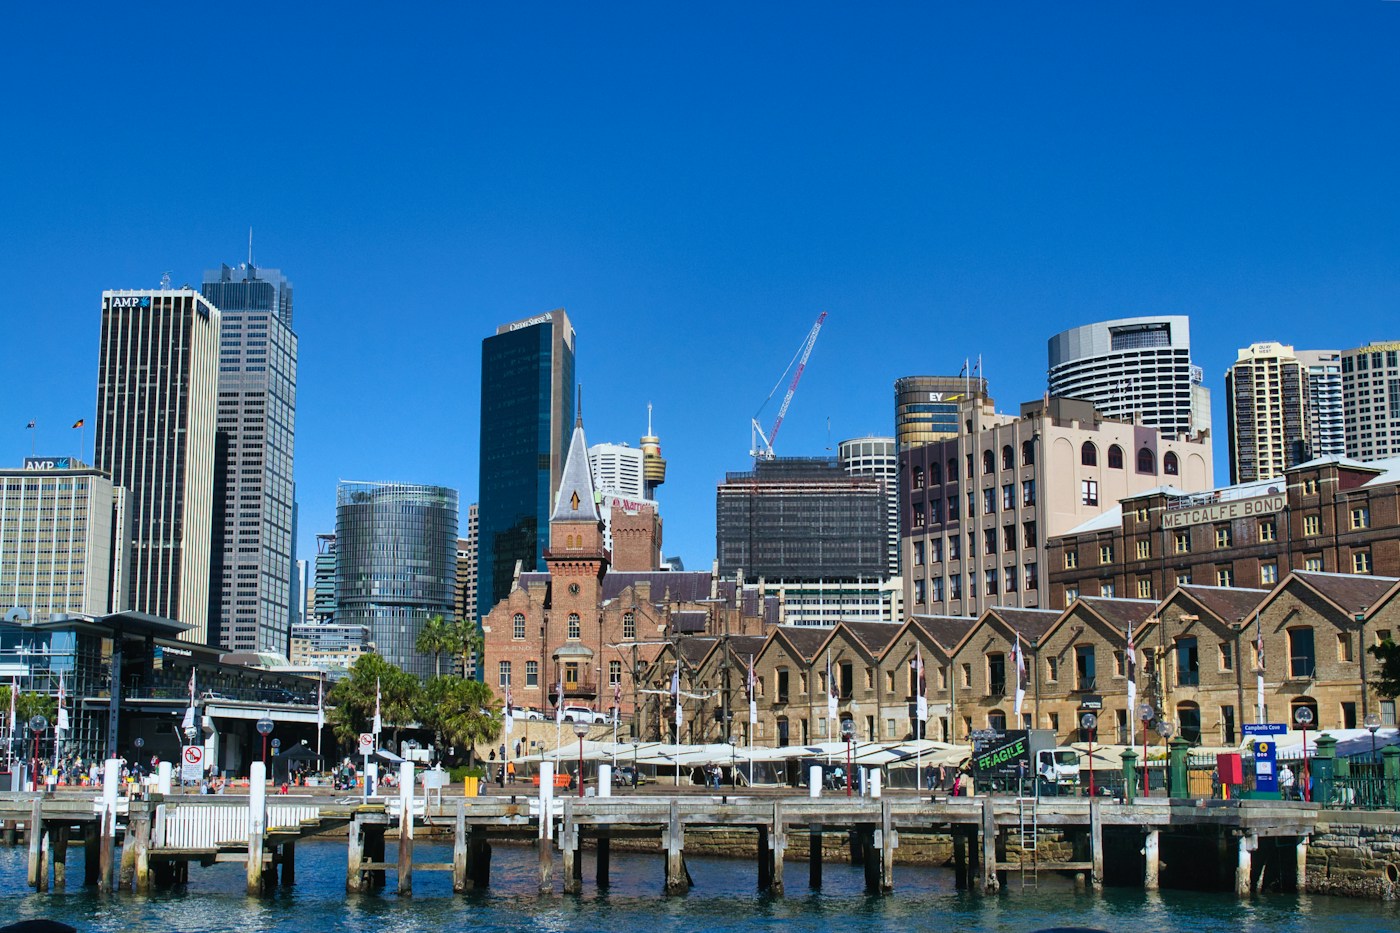
Photographs are market illustrations, not photographs identifying the properties discussed. Singapore skyline: CHUTTERSNAP. Singapore bayfront: Florian Delée. Sydney skyline: Phillip Flores. Used under the Unsplash License. Chart and table: DealTide Research, from the linked articles.
THE DEPTH BEHIND THE DATA
11,995 transactions. A research base ready to explore.
Core coverage from 2020. Selected earlier transactions included.
11,995APAC transaction records
US$1.07tnCumulative recorded completed volumeH1 2026: US$87.7bn
19APAC markets represented
2020 onwardCore historical coverage
Coverage as of: 22 November 2026 at 22:30 UTC · Records span all transaction stages. Volume sums qualifying completed transactions across the archive, including repeat sales over time. Coverage varies by market, sector and year.
5 reviewed multi-market records span APAC (US$1.276bn reported). Each source record is counted once in the regional archive; a record containing separate acquisitions remains provisional until split. Full prices are not assigned to individual countries. US$220.7m qualifies as completed direct volume; US$141.5m is an indirect investment, and US$913.5m remains under transaction review.
Explore recorded property deals across available markets and sectors, with linked assets, transaction values and buyer and seller details where disclosed.
US$35,115,000Completed; included in market volumeReported
AUD 50,000,000Completed; included in market volumeReported
3,436.92USD per sq m NLACalculation and FX
USD per sq m NLA
Source-supported price and denominator; 2 November 2026 report-date reference FX, not exact settlement-date FX. 10,217 sq m NLA.
FX reference date: 2026-11-02
FX source and basis: https://currencyapi.com/central-bank-exchange-rates/rba/usd/2026
7.76%Reported net passing yieldSettlement was reported on 2 November 2026; the exact closing day was not disclosed. Net passing yield reported by Business News Australia, not derived from older income. NLA is 10,217 sq m.
30 Oct 2026Contracted
Income availableOriginal sourceHong Kong · Hong Kong · Mixed-use
Han Bliss Global Limited (wholly owned by Dr Chan Chung Bun, Bunny / 陳振彬)Seller: Link REIT through Link (HK) Holdings Limited
≈ 4.35%Calculated historical actual NPI yield referenceUnaudited FY ended 31 March 2026; historical actualIncome as of 2026-03-31Unaudited historical income; initial agreed price is subject to completion-account adjustments. Contracted, not completed. Not a reported cap rate.
30 Oct 2026Contracted
Income availableOriginal sourceHiroshima · Japan · Industrial
1,166.86 (indicative)USD per sq m NLAIndicative calculation and FX
Full trust beneficial interest consideration / approximately 44,885 sq m NLA
Indicative USD conversion using 30 October 2026 RBA reference FX, not settlement FX; contracted transaction, completion unverified. Issuer NLA is approximately 44,885 sq m; therefore the PPU is approximate.
FX reference date: 2026-10-30
FX source and basis: https://www.rba.gov.au/statistics/frequency/exchange-rates.html
5.7%Issuer-reported FY2025 pro forma NPI yieldFY2025 pro forma NPI / agreed acquisition consideration; not a stabilized or forward cap rate. WALE by gross rental income: pro forma 2.3 years as at 30 September 2026, assuming renewed leases were already in effect, not an unqualified observed WALE. Contracted; completion unverified.
18 Nov 2026Completed
Income availableOriginal sourceSingapore · Singapore · Office
UndisclosedSeller: CapitaLand Ascendas REIT
US$46,532,025Completed; included in market volumeReported
SGD 60,000,000Completed; included in market volumeReported
2,567.57USD per sq m GFACalculation and FX
USD per sq m of GFA
CapitaLand Ascendas REIT confirmed actual completion on 2026-11-18. PPU is per sq m of GFA; USD conversion uses the RBA published cross-rate for the actual completion date, not a bank execution rate.
FX reference date: 2026-11-18
FX source and basis: https://www.rba.gov.au/statistics/frequency/exchange-rates.html?v=2025-09-15-19-43-07
≈ 4.50%FY2025 historical gross revenue / sale priceNot a current or net cap rate.
18 Nov 2026Completed · reference date
Income availableOriginal sourceSydney · Australia · Industrial
6.92%Calculated starting net yieldStarting annual net rent under the Australia Post six-year leasebackEntire Sydney Gateway distribution property at 2A Factory Street, Granville, subject to the Australia Post leaseback.Broker-marketed commencing net rent on the six-year Australia Post leaseback; calculated on A$100m before GST. Exact commencement date not verified.
US$595,245,052Completed; included in market volumeReported
KRW 800,000,000,000Completed; included in market volumeReported
9,049.8USD per sq m
Not reported
30 Sept 2026Completed
Income availableComparables availableOriginal sourceSydney · Australia · Office
Aware Real EstateSeller: Link REIT
US$158,000,000Completed; included in market volumeApproximate price
AUD 225,875,000Completed; included in market volumeApproximate price
11,150.71USD per sq m NLA
≈ 7.50%Calculated historical annualised net rental yield referenceAnnual net passing income as of 2026-03-31Income as of 2026-03-31Whole-property equivalent income / price basis.
30 Sept 2026Completed
Income availableOriginal sourceSingapore · Singapore · Residential
US$16,977,425Completed; included in market volumeReported
AUD 24,250,000Completed; included in market volumeReported
5,917.54USD per sq m
6.26%Reported cap rate / yield≈ 6.16%Calculated historical passing NOI yield referenceHISTORICAL as at May 2026: annual net operating income; day not stated
21 Jan 2026Completed
Income availableSeoul · South Korea · Hospitality
Lotte REITSeller: Hotel Lotte Co.
US$180,722,045Completed; included in market volumeReported
KRW 265,000,000,000Completed; included in market volumeReported
6,488.6USD per sq m GFA
5.21%Calculated contractual gross rental yieldDisclosed first-year annual lease rent schedule, ownership/lease commencement planned 21 January 2026; not calendar 2026 collected income
10 curated sample records · Updated 22/11/2026
These 10 examples show different transaction structures and data availability. Capital lenses can overlap. Income, comparables and articles are shown only where available; article access is checked separately. Create a free account to search the database and choose 3 full records.
FOLLOW THE CAPITAL
Behind every deal, a clearer picture of the player.
Connect the asset to the buyer, seller and capital behind them. Keep the investment vehicle, its manager and the property’s location distinct.
Private capitalListed capitalDirect capital
Sample Player
LISTED CAPITAL · SINGAPORE
CapitaLand Integrated Commercial Trust
VehicleSingapore-listed REIT
Recorded roleBuyer
Sample activity only. Full profile totals await the audited launch database.
EVIDENCE YOU CAN INSPECT
Know what’s covered. Know what’s missing.
Core coverage from 2020, with selected earlier transactions. Depth varies by market, sector and year. Review our methodology and inspect each dataset’s scope and field availability before purchase.
All available sectors and capital lenses in your selected market.
One-time licensed historical snapshots; ongoing updates and Flow access are sold separately. Country, sector and capital-lens datasets can overlap. The Complete APAC Archive includes each transaction once.
Need a customised dataset? Email hello@dealtide.io with your markets, sectors and date range.